Board Deck Best Practices
![]() Updated
Updated
Leverage Knoetic insights to make your Board presentation a breeze.
Below are some commonly used reports that we've learned to be useful for our People leaders when presenting to the Board.
While we recommend considering your company's unique strengths and challenges, we hope this can be useful as a starting point!
⭐️ A sample board deck presentation we created that you're welcome to use!
Workforce
Use our Explorer Analytics in Knoetic for these common Workforce reports:
- Workforce breakdown by location (by home state, country, office, etc)
- Workforce breakdown by remote or hybrid (%)
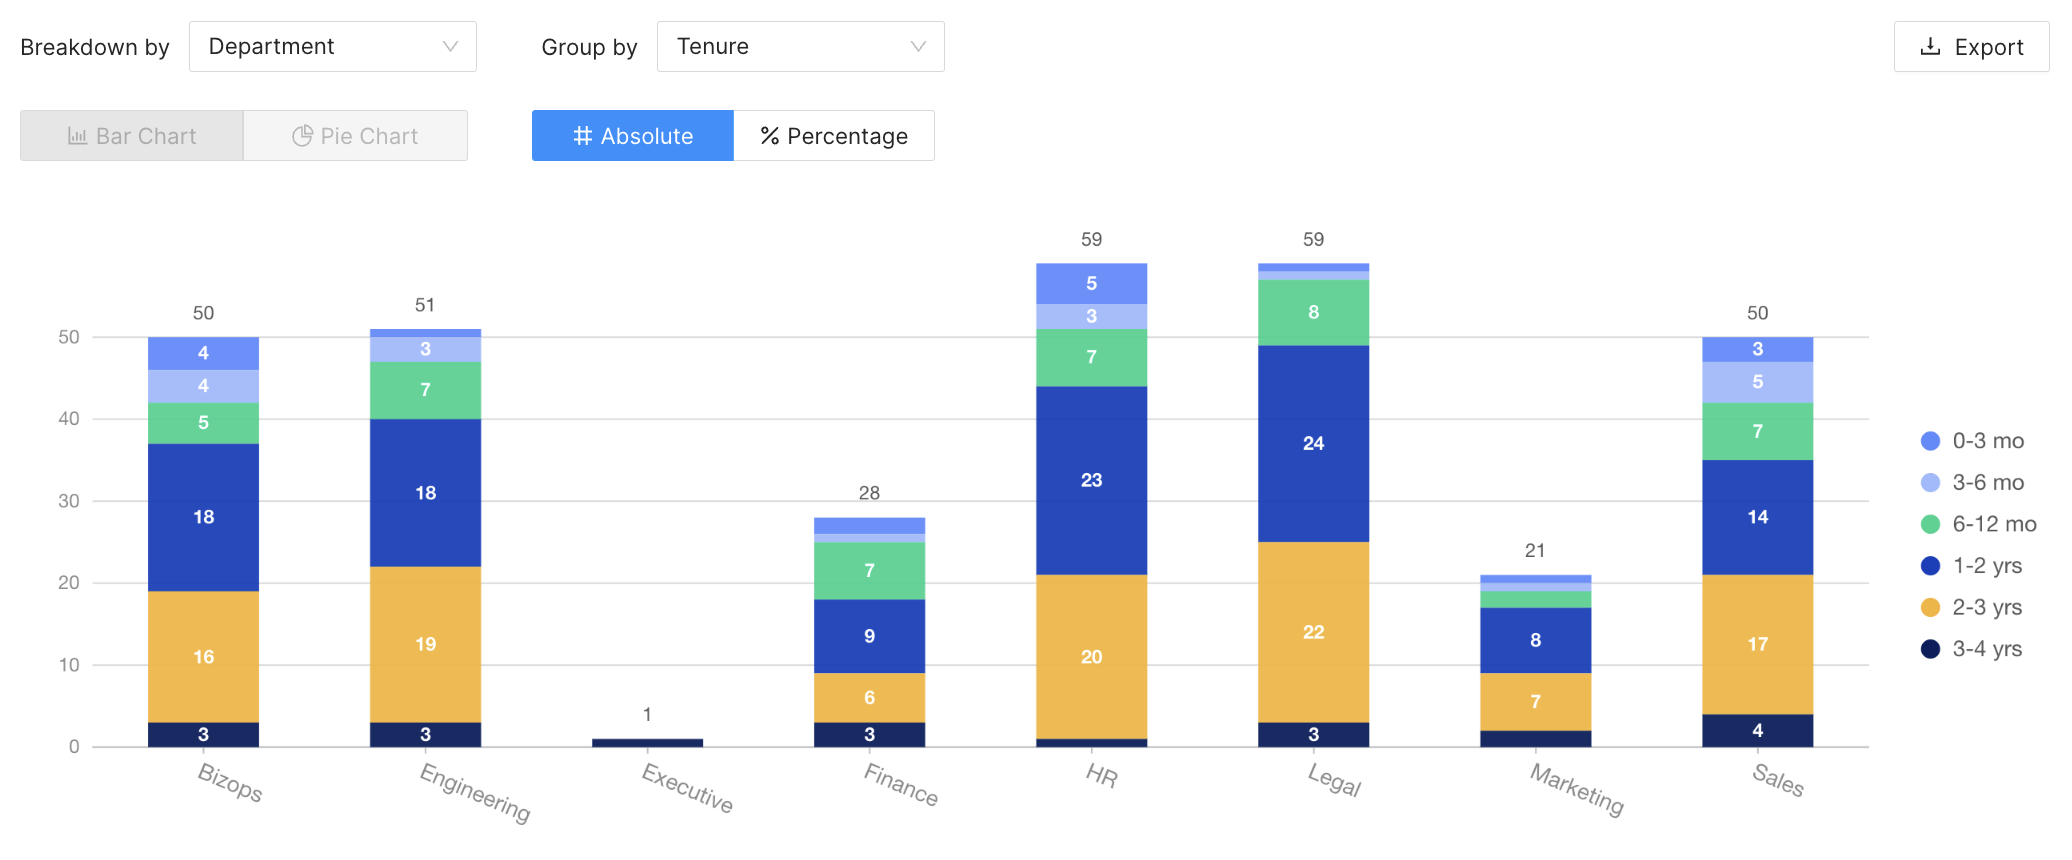
- Workforce breakdown by department
Here is an example of an exportable Department by Tenure chart:
Diversity, Equity & Inclusion
Use our Explorer Analytics or DEI Analytics for these common DEI reports:
- DEI breakdowns, such as:
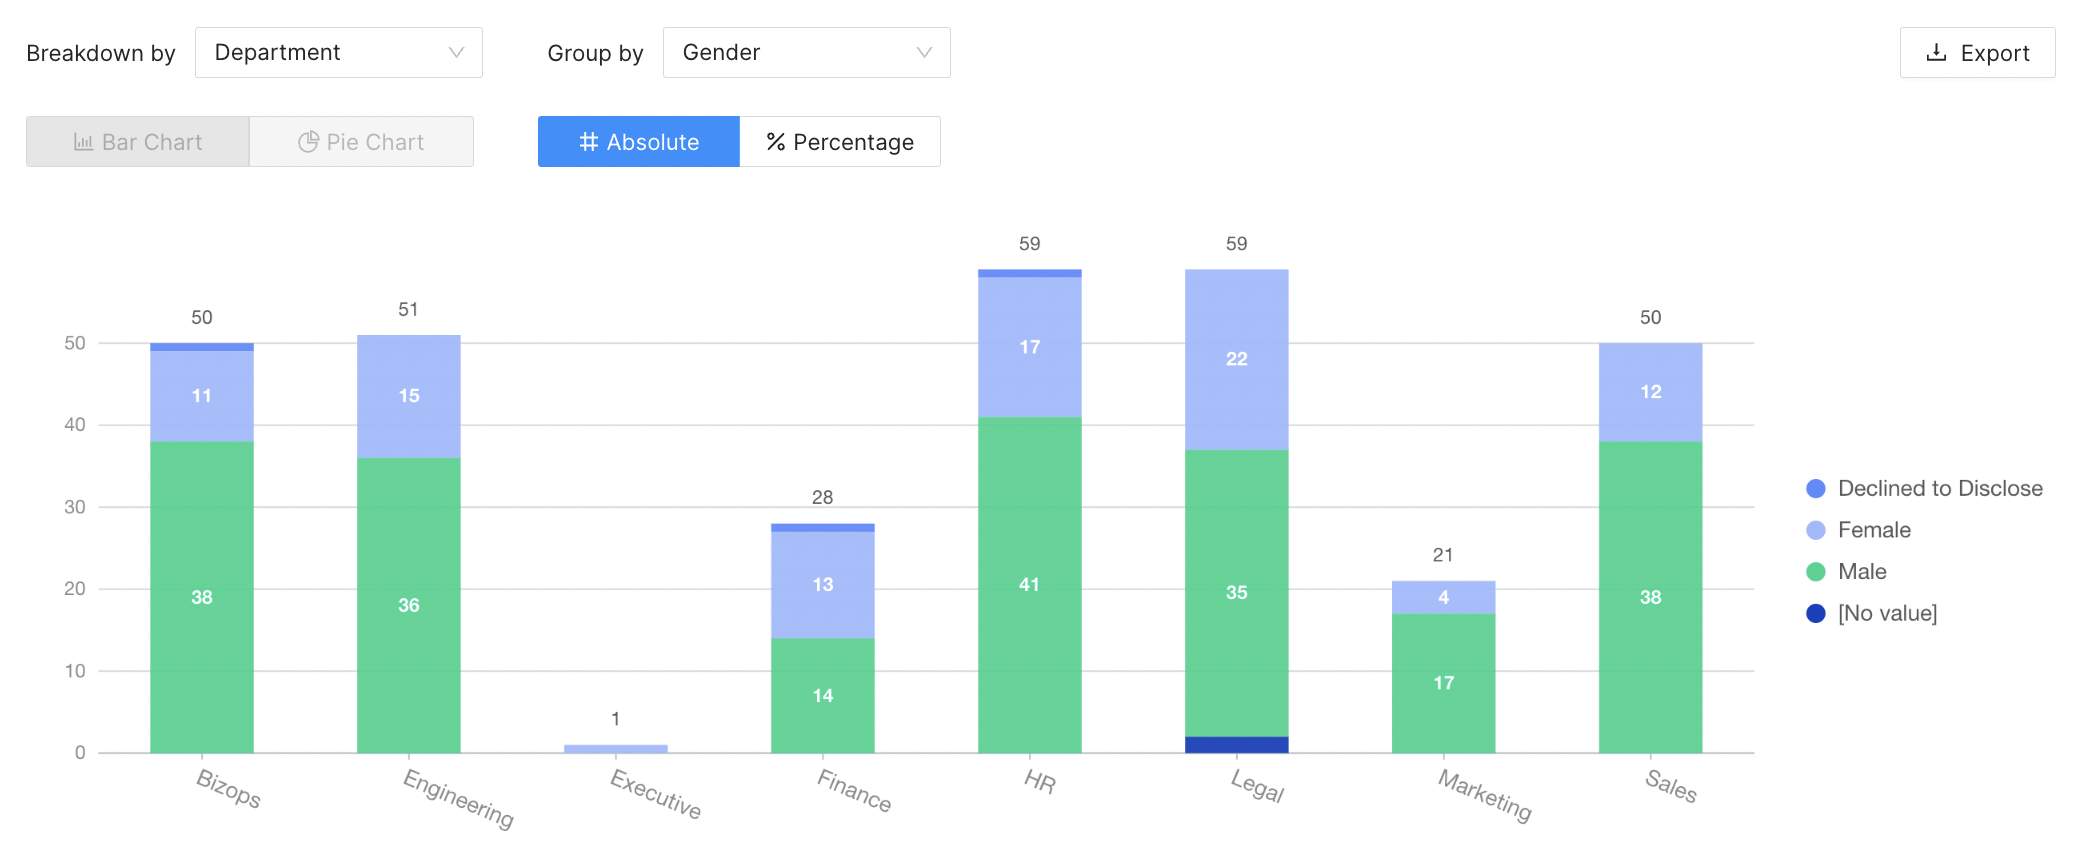
- Gender breakdown across departments & management
- Ethnicity breakdown across departments & management
For example, here is an exportable chart showing Department by Gender:
Attrition
Use our Attrition Analytics for these common Attrition reports:
- Overall Attrition, including annualized attrition
- By quarter
- By department
- By location
- By tenure
- Termination reasons of why employees have left
- Diversity, Equity & Inclusion analytics
- Attrition by gender
- Attrition by ethnicity
- Regrettable vs. Non-Regrettable Attrition
- Voluntary vs. Involuntary Attrition
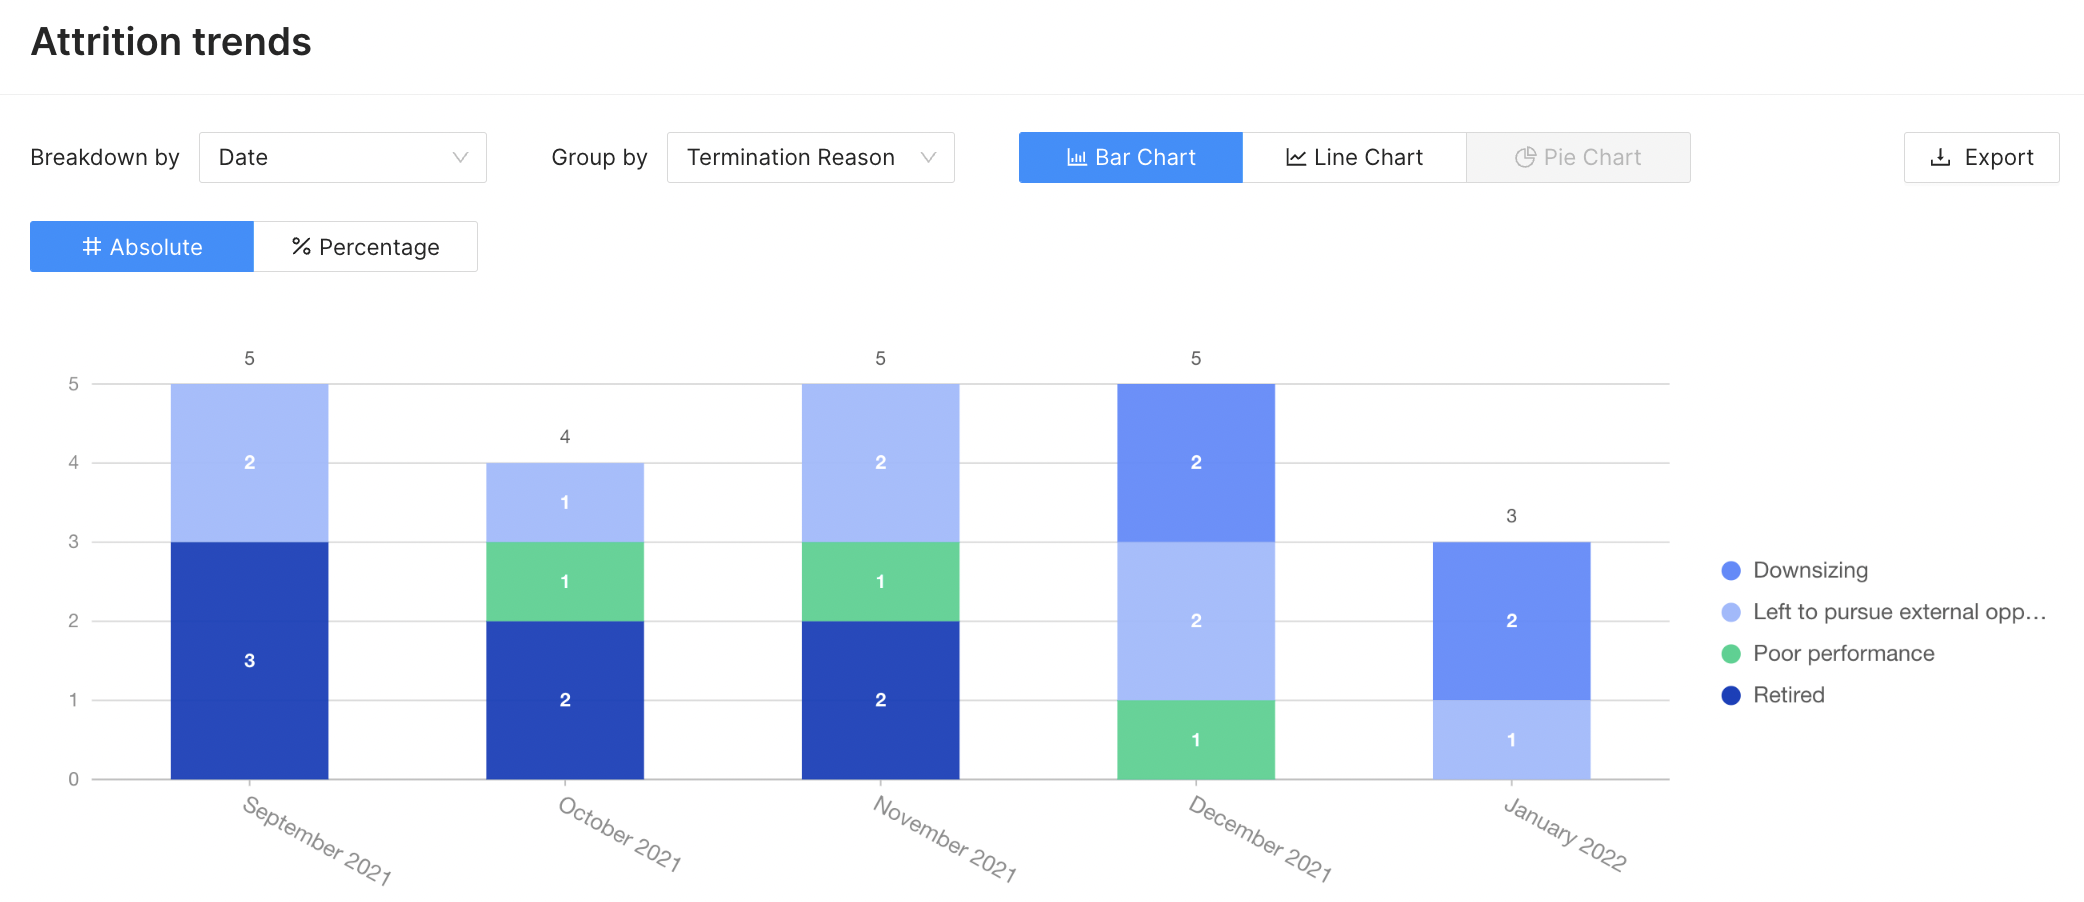
For example, here is attrition over time by termination reason. You can layer any "Group By" field that's available in your instance.
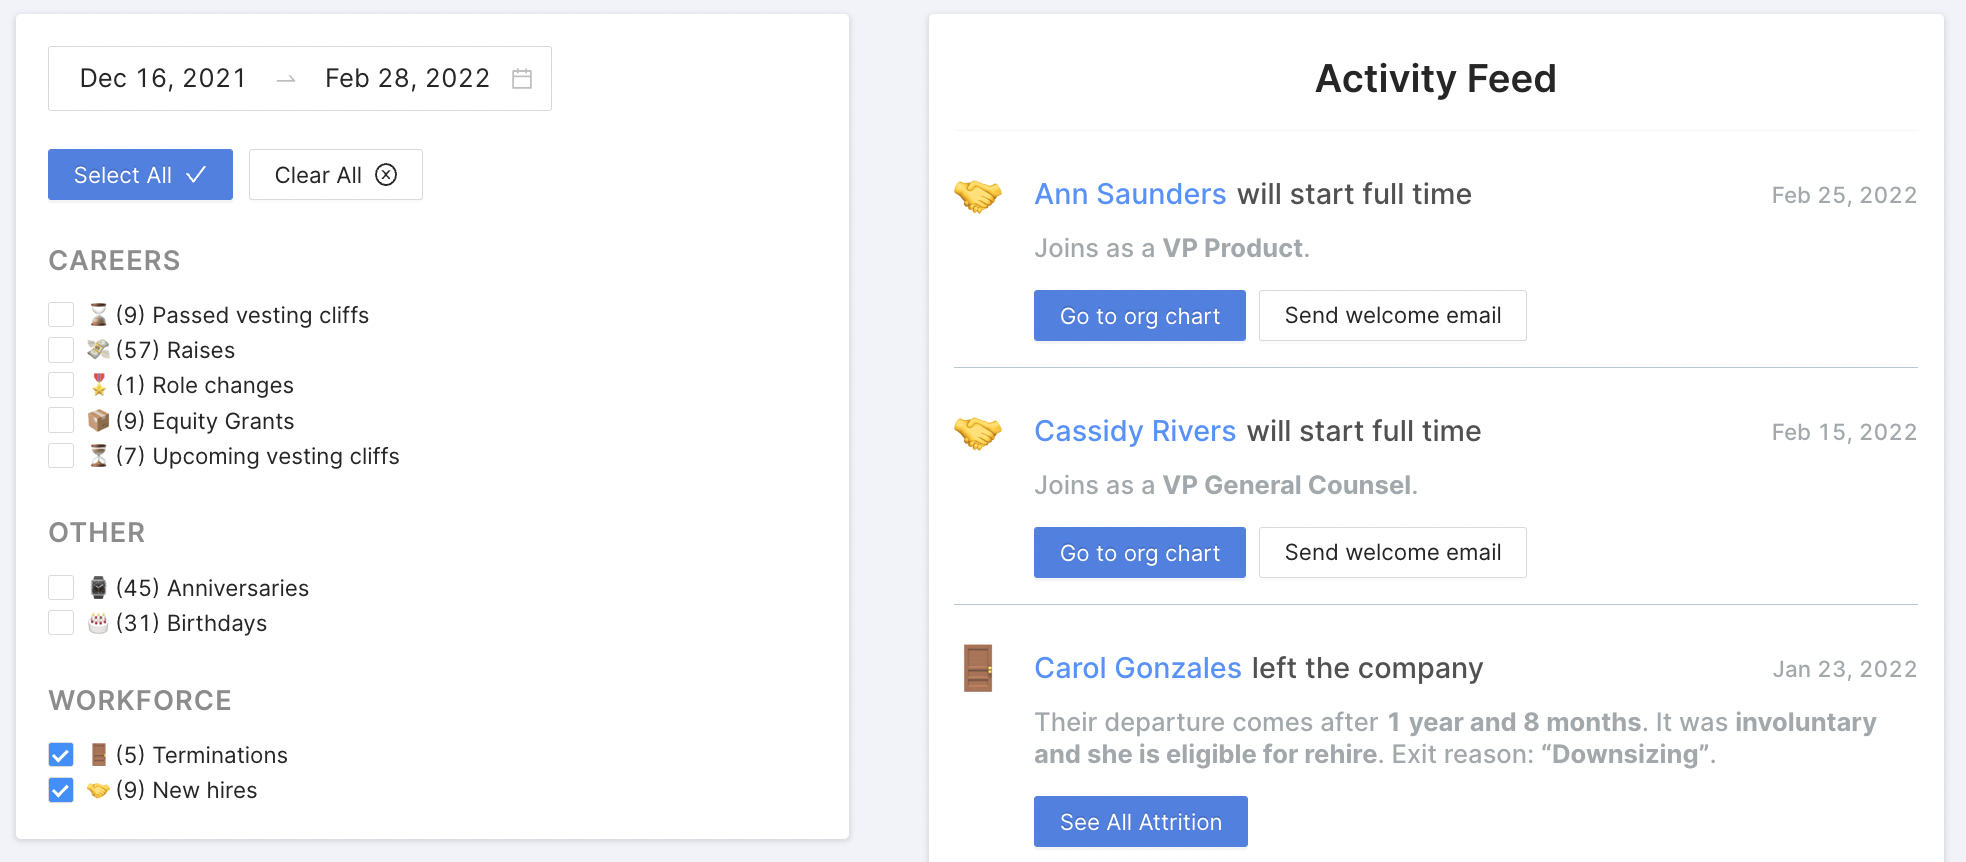
Notable Hires & Leaves
Our Activity Feed is great for viewing recent hires and terminations across the company.
Have questions or need help getting started? Email success@knoetic.com to reach out team.
If you're a CPOHQ member, explore our forum, polls, and library for additional tips.