Overview Dashboard
![]() Updated
Updated
Overview dashboard
This is the first place you’ll land when you log into Knoetic. Referred by many as their “security blanket”, it’s designed to provide quick, high-level insights to help you keep a pulse on your organization.
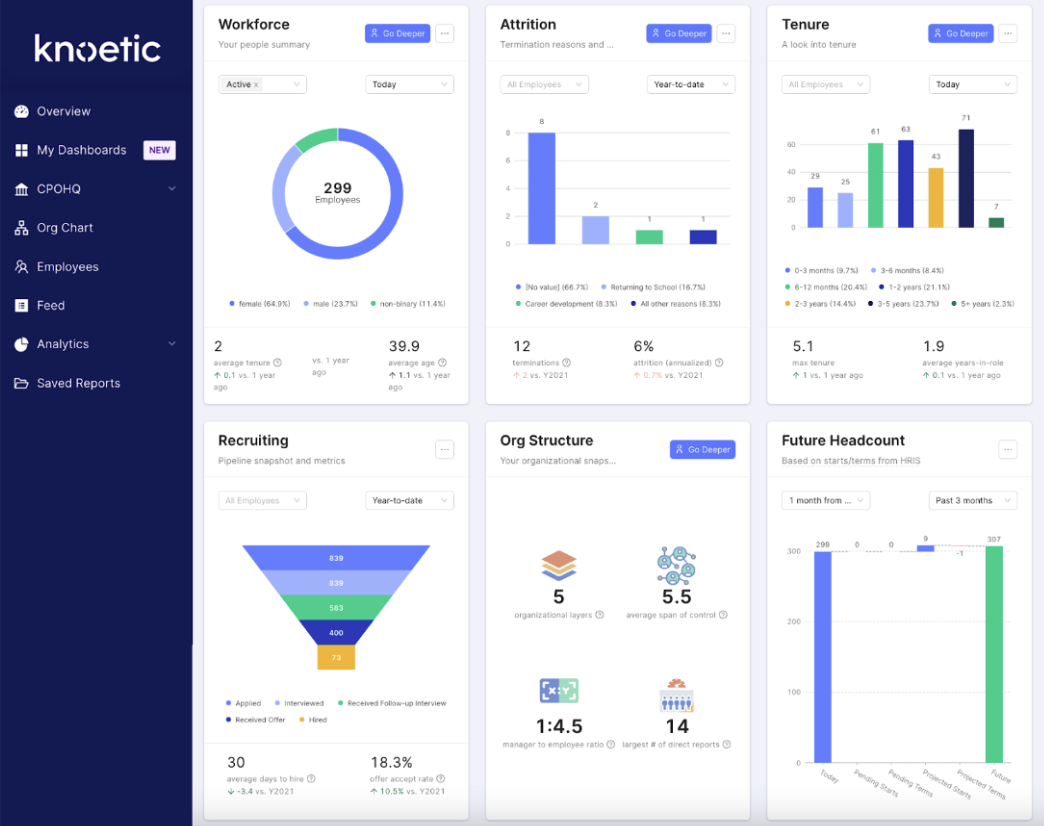
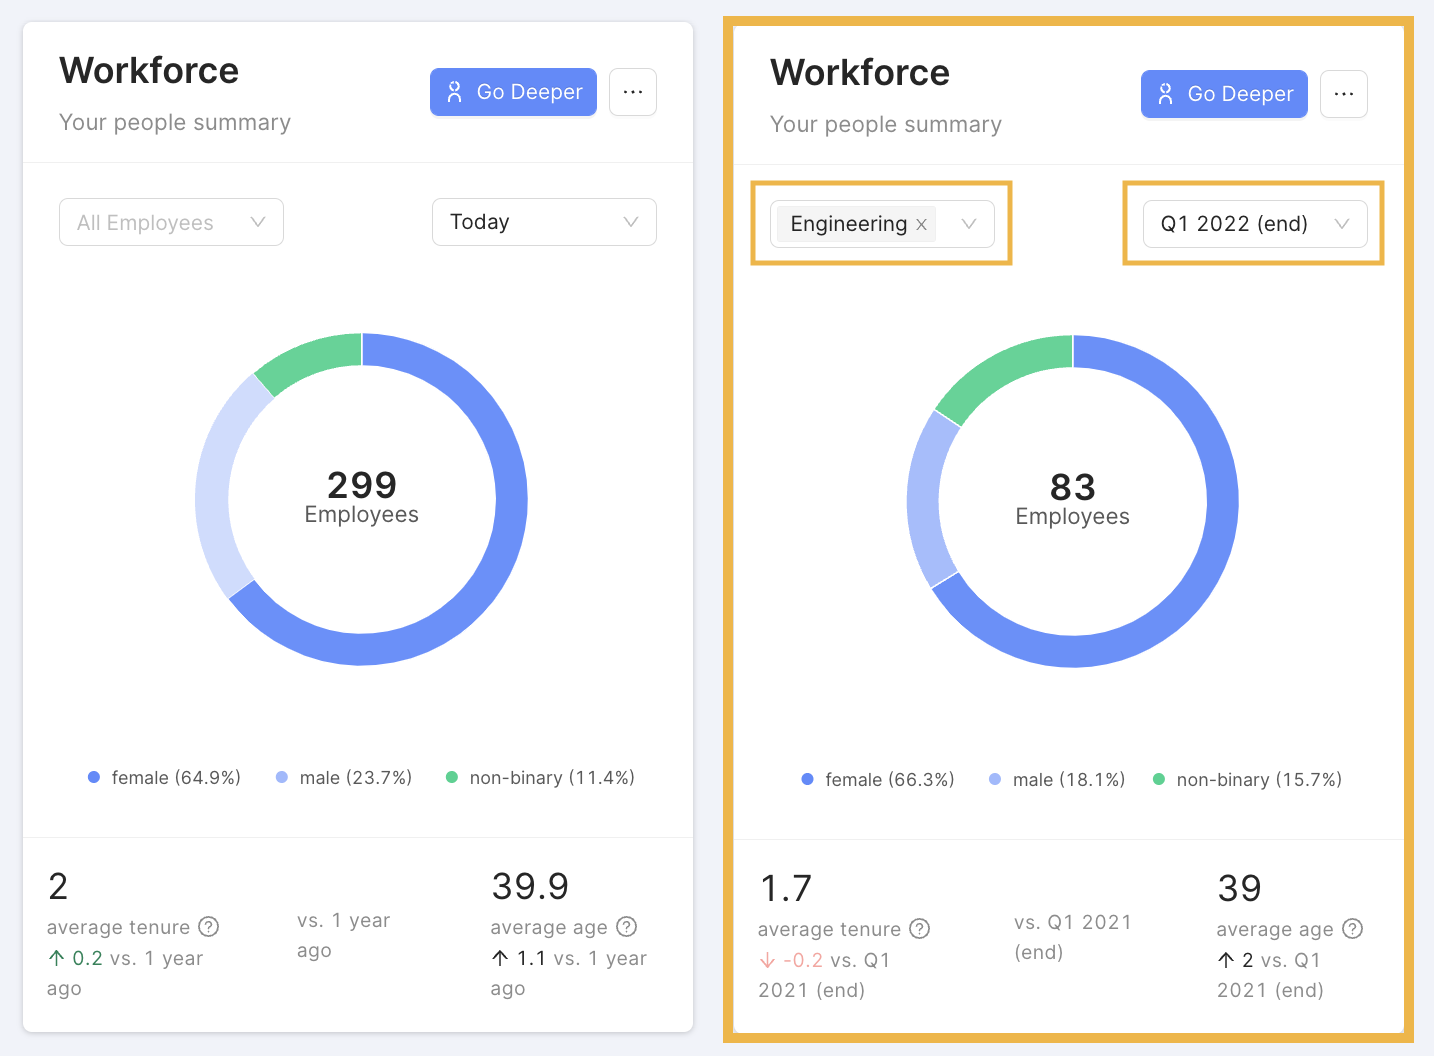
The Workforce tile is your headcount summary at-a-glance. View your headcount today or during different key points in time. You can view a subset of your workforce by any filter. If you want to break the data down further or see it over time, click “Go Deeper” to explore much more.
The below examples compare a view of your total company headcount today (left) versus a view of your Engineering team headcount at the end of Q1 2022 (right).
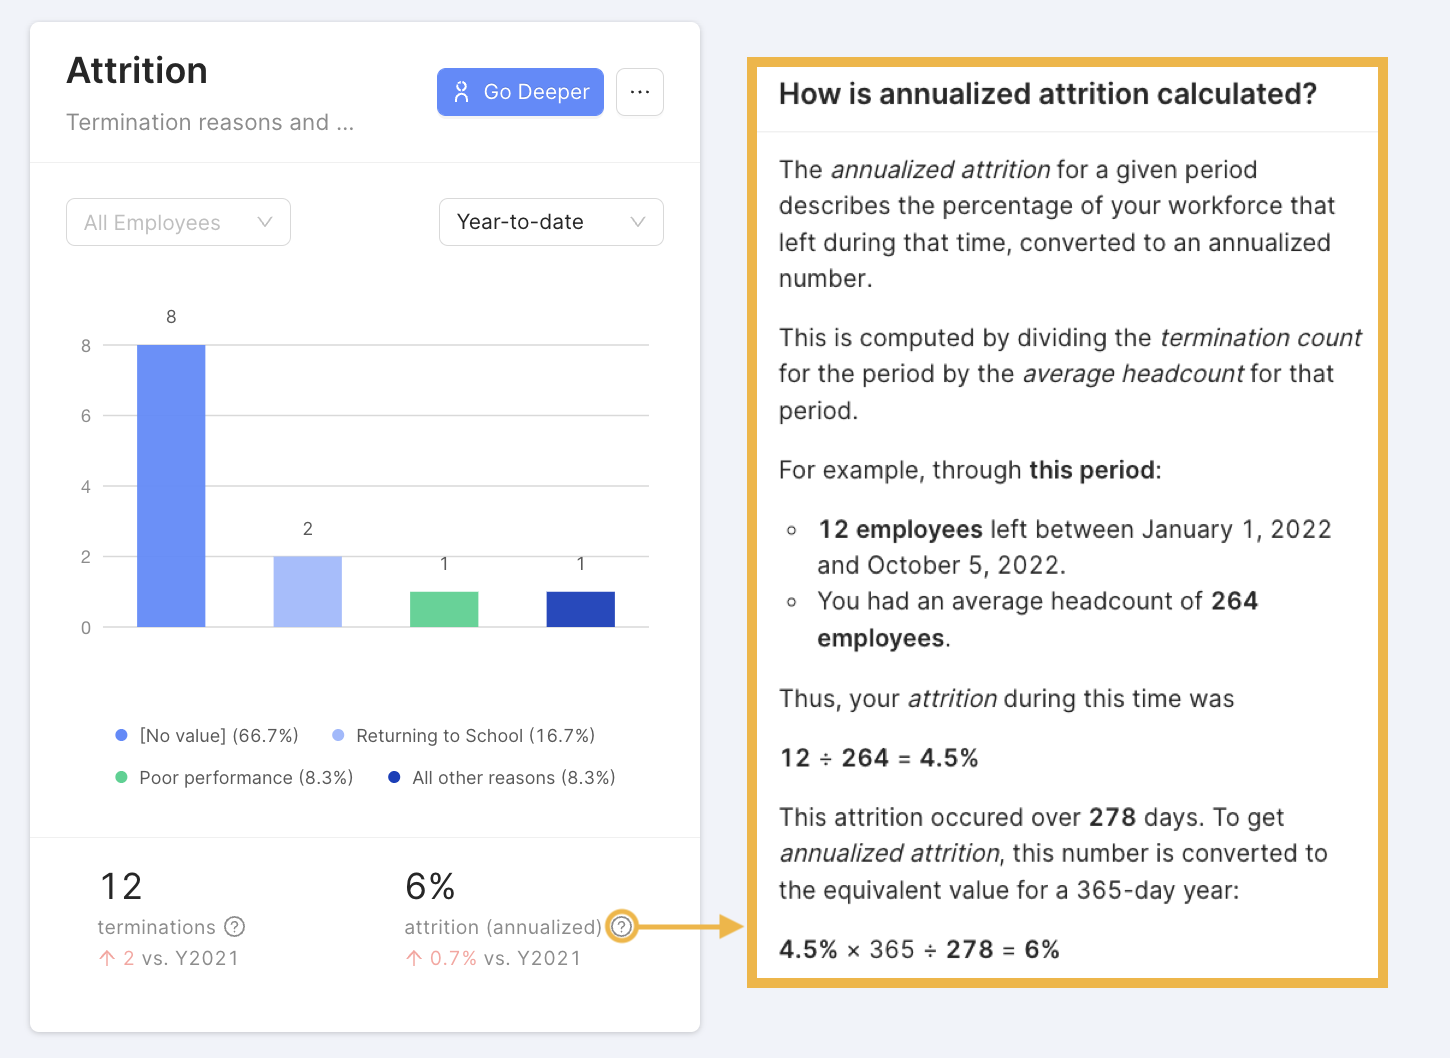
The Attrition tile helps you understand why employees are leaving your company. It consists of an overview of termination reasons as well as Termination count and Annualized Attrition rate. You can also filter this by any field value. “Go Deeper” will allow you to analyze much more.
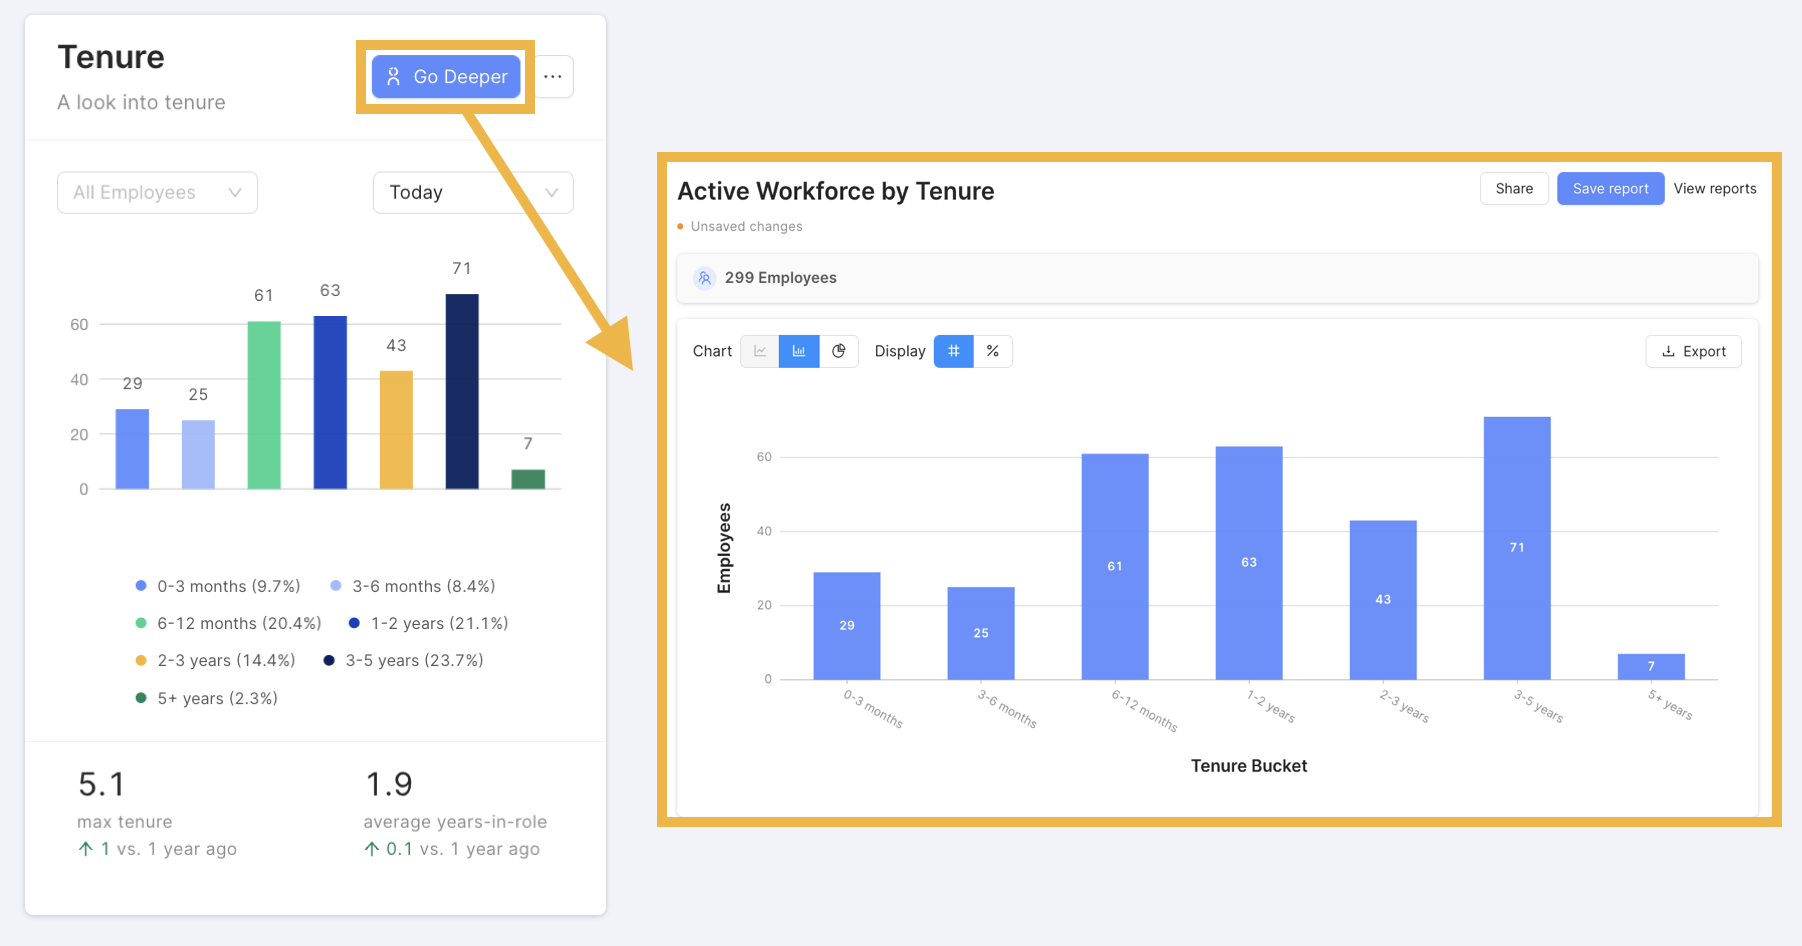
The Tenure tile helps you understand tenure at a glance. Click “Go Deeper” to access Explorer Analytics to dive further into your data.
The Recruiting tile pulls data from your Applicant Tracking System (ATS) to provide a brief snapshot of your candidate pipeline and high level metrics.
The Org Structure tile provides insights related to your organization structure. Our highlighted metrics provide deeper insights into span of control. Click the “Go Deeper” button to access your Org Chart. When you're in the Org Chart, be sure to click the blue button in the top right to view Org Chart Summary Stats!
The Future Headcount tile shows your forecasted headcount. Pending Starts are based on employees in your HRIS with future-dated starts. Pending Terms are based on employees in your HRIS with future-dated terminations. Projected Starts and Projected Terms are based on Knoetic calculations across your historic new hire and attrition trends. You can adjust the time-period for analysis.
The Base Salary Cost tile and Compensation tiles provide quick snapshots of your salary distribution across the company. “Go Deeper” to drill deeper into pay equity at your organization.
The Engagement tile tracks four top company-wide engagement metrics. It also shows you trends between your current and previous engagement cycles.