Custom Dashboards
![]() Updated
Updated
Article: show people how to find dashboards, view reports, share them, and understand why they might not see a dashboard from their colleague.
Pages that'll go into more detail:
- Editing Dashboards
- Dashboard sharing permissions
- Adding new reports to dashboards
- Viewing and Using Saved Reports
Build a personalized view of your top-of-mind insights.
Keep an eye on the KPIs, metrics, and insights that are most important for you! Custom Dashboards allow you to build multiple views of your saved reports. You can add any Explorer, Attrition, Compensation, or Employee List report to your dashboards.
A few things to note:
- Full & Restricted users will have the ability to create their own custom dashboards.
- You can share custom dashboards to empower data-driven decisions across your team.
Navigating your dashboards
Each dashboard can serve a different purpose. Create department-specific views as well as deep cuts into trends like attrition and DEI.
The best way to navigate to existing dashboards within your Knoetic account is the dashboard directory on the left-hand side of the page.
Open My Dashboards -> Hover over the minimized sidebar to access all your dashboards.
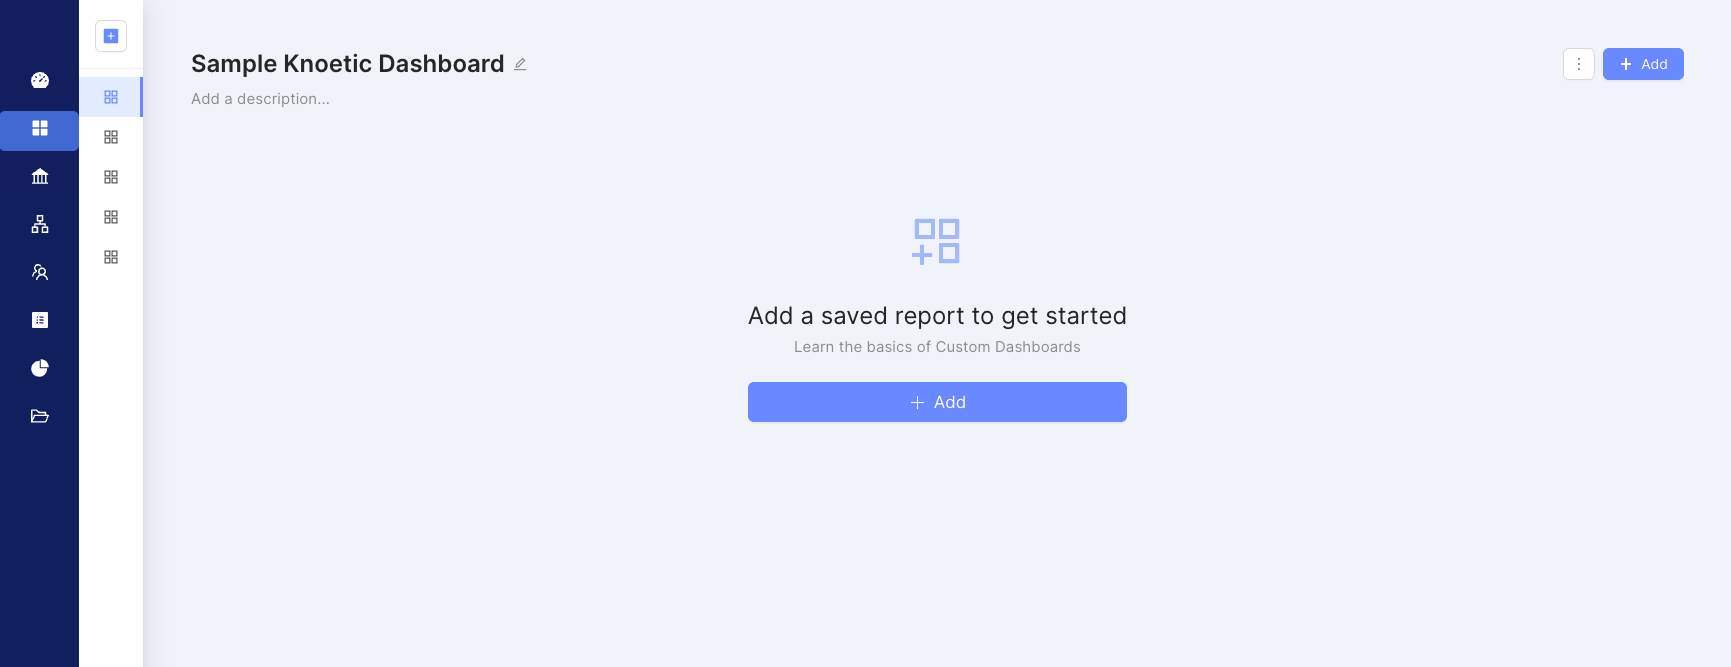
Creating a new dashboard
On the My Dashboards page, click "+ New Dashboard" at the top of the left-side menu. The new untitled dashboard will be created immediately.
And let's make sure to name your dashboard, too! Simply click the edit icon to the left of the title, type in a name, and click save.
Add new or existing saved reports
You can add your own saved reports, or add saved reports created by other teammates.
- Starting from any dashboard, add a report by clicking the "Add" button near the top right of the dashboard.
- If the dashboard is empty, click the button in the center of the page. This will open a popup from which you can choose to add an existing report.
- Supported reports include Explorer, Attrition, Compensation, and Employee List (Employees).
- You can search by keywords and report types, then add one or multiple reports to the dashboard.
Change the format or report order
Rearrange or resize report visuals with our simple drag-and-drop capability.
- To change the order of your reports, simply drag any report visual to your desired position.
- To remove a report, click the three dots on the top right-hand side and select "Remove".
A few things to keep in mind:
- You can fit anywhere from 1 to 3 report visualizations within a row.
- Add or drag a report to its own line to dedicate more real estate to it.
- To change a graph's visual format (e.g. bar graph vs. line graph vs. pie chart), click on the report title to edit the original report. Save your changes and see them reflected on your dashboard automatically.
Sharing Dashboards
Share your custom dashboards to empower data-driven decisions across your leadership team.
Custom dashboards are built with shared reports which update in real-time, allowing key stakeholders to have access to the analytics they need, at any time.
How to Share Dashboards:
Once you’ve created a dashboard, click “Share” at the top right corner.

A pop-up will appear that outlines your sharing options:
- Invite Teammates: To share your dashboard with specific team members, type in their emails. You can then designate whether you want the person(s) to have:
- “Dashboard Only” access (meaning the user cannot open and dig into the reports in the dashboard), or
- “Dashboard & Drilldown” access (meaning the user can click into and access the individual reports as well as the dashboard itself). Then, click “Invite.”

- Edit Permissions
- You may edit any user’s permissions directly on the specific dashboard you want to make changes to. In the dashboard share settings, click the drop-down icon next to any user’s name. This module will allow you more control over how collaborators view and manage their access.

- General Access: To share more broadly with your organization’s users, choose a setting for your dashboard that is:
- “Private” (meaning only you and any teammates you’ve invited can access it),
- “Dashboard Only” (meaning every Knoetic user in your organization can view the dashboard but not click into the reports), or
- “Dashboard & Drilldown” (meaning that every user in your organization can both view the dashboard and click into the reports inside it). You can then share a link to the dashboard with your organization’s users with the selected settings.

Note: Users with Restricted access to Knoetic will not be able to see specific data or reports in Shared Dashboards that they are not permitted by their current access settings. [Add link to manage user permissions]
When ready, click “Done” to implement your changes.
Shared User Experience
When a dashboard is shared, the user will receive an invitation from us to access it. If new to Knoetic, they will be asked to create their login credentials. If they have an account, they will be asked to login and can immediately view the shared dashboard under “Shared With Me” within the “My Dashboards” section.

The user will see their level of access to the shared dashboard which reflects …
- One for “Dashboard Only”
- One for “Dashboard & Drilldown”

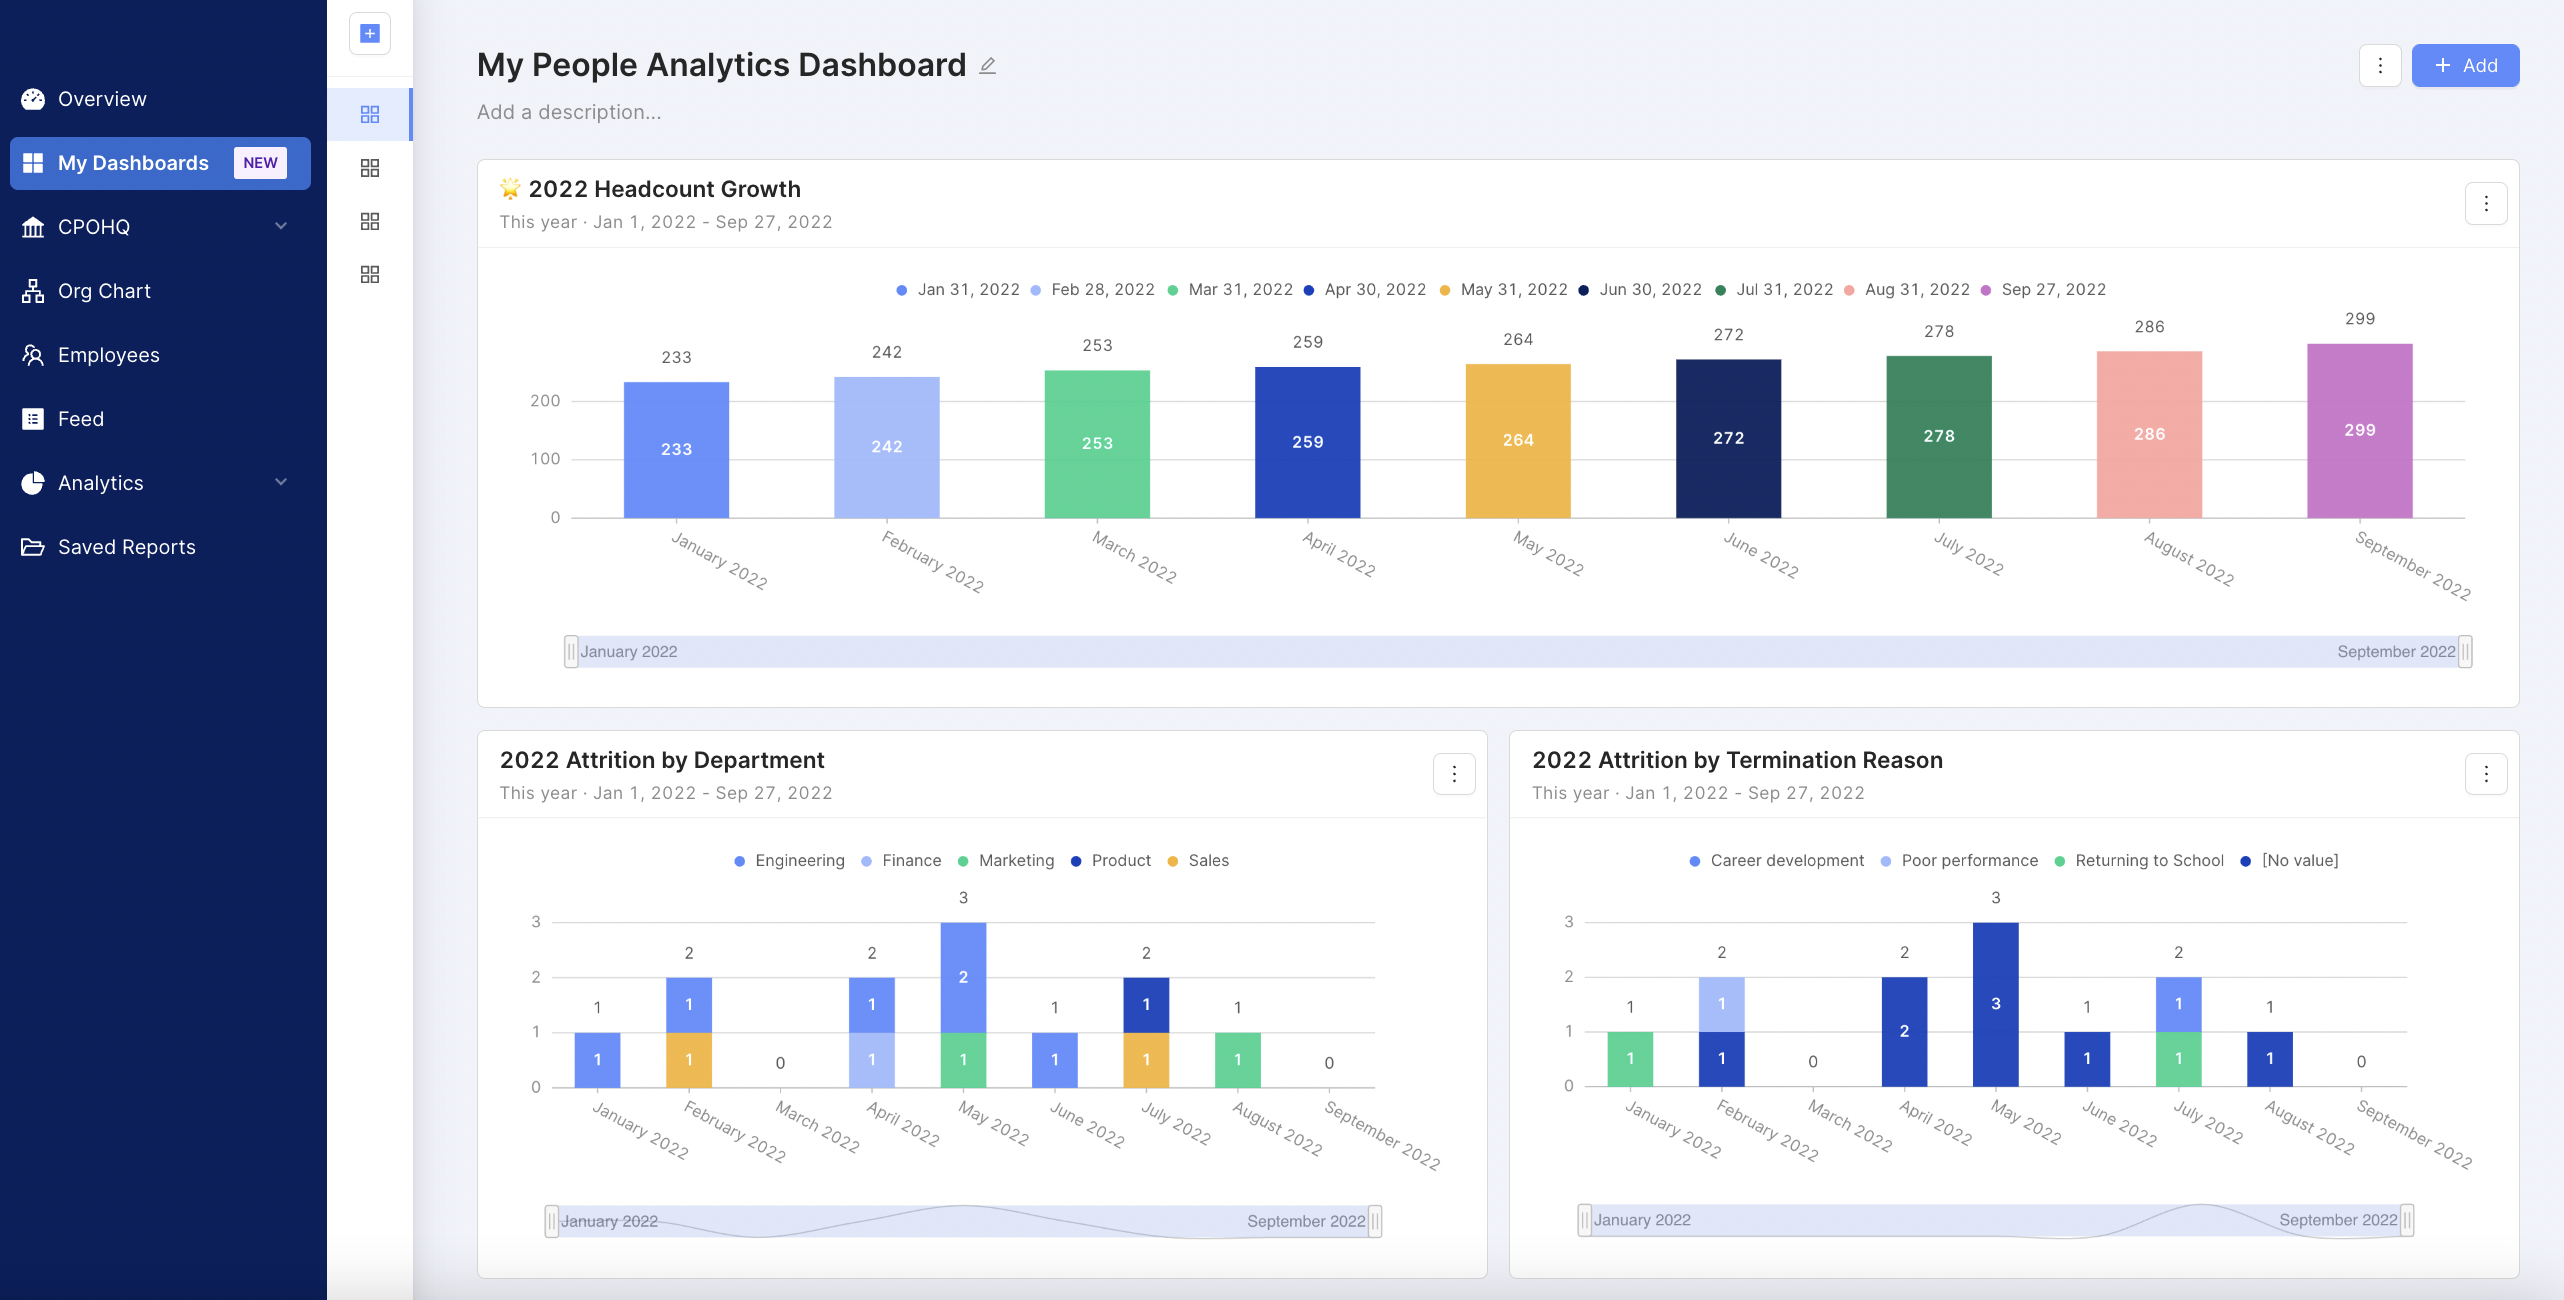
Example Dashboards
To help you get started, we’ve included some ideas for dashboards and the associated reports to tell the right high-level story for your team.
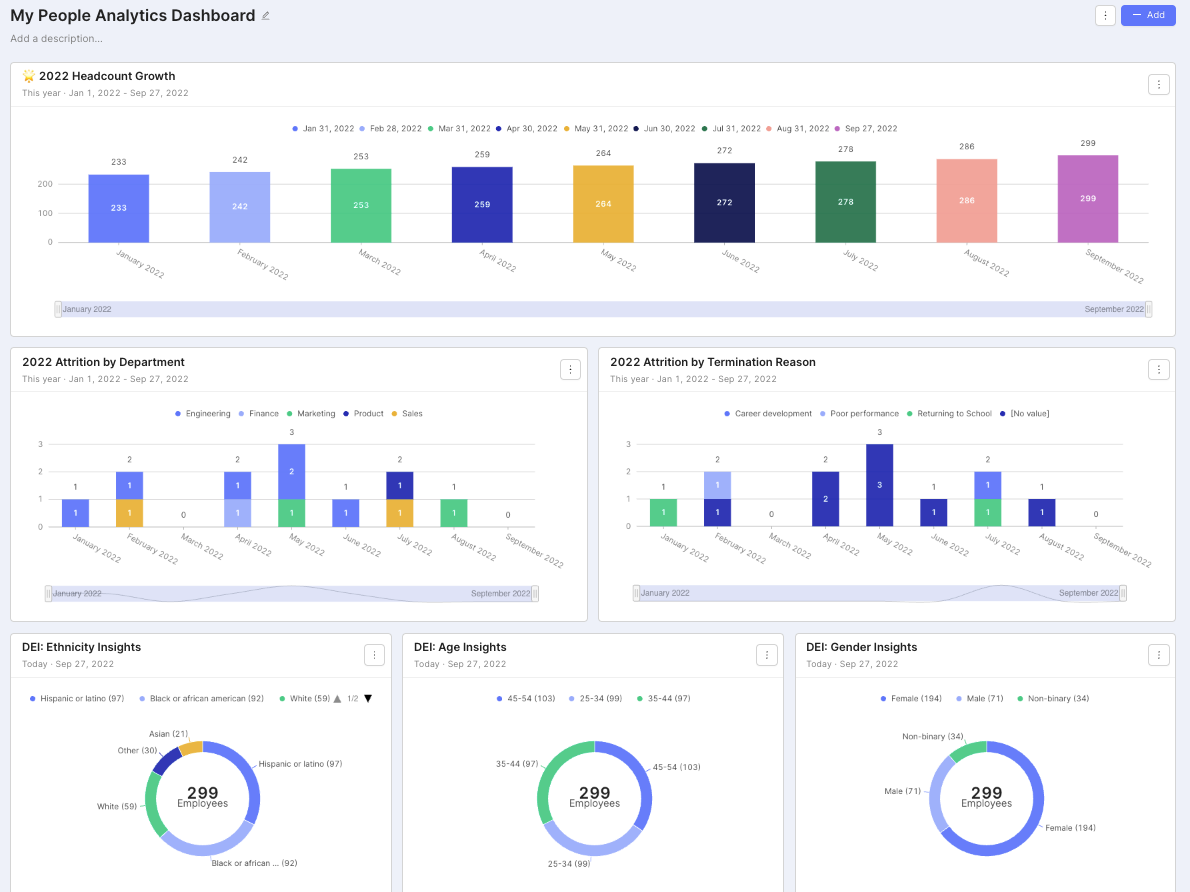
Overall Org Dashboard
Leverage our standard Knoetic dashboard as inspiration, or highlight the metrics that are most important for your team. You may consider adding metrics like:
- Current headcount
- Headcount growth over time
- Year-to-date attrition
- Current DEI breakdowns
- Current Tenure breakdown
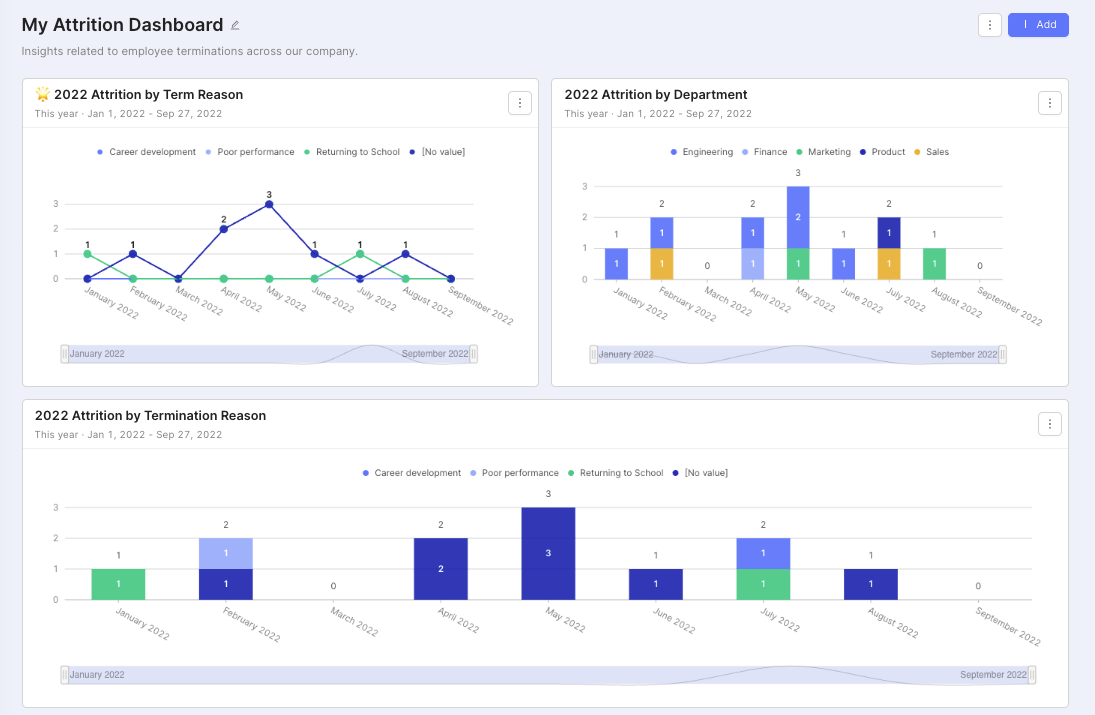
Attrition Dashboard
Keep a pulse on why employees are leaving and find opportunities to retain top talent. You may consider adding insights like:
- Year-to-date Attrition Over Time
- Year-to-date Attrition by Department
- Year-to-date Attrition by Termination Reason / Type / Regretfulness
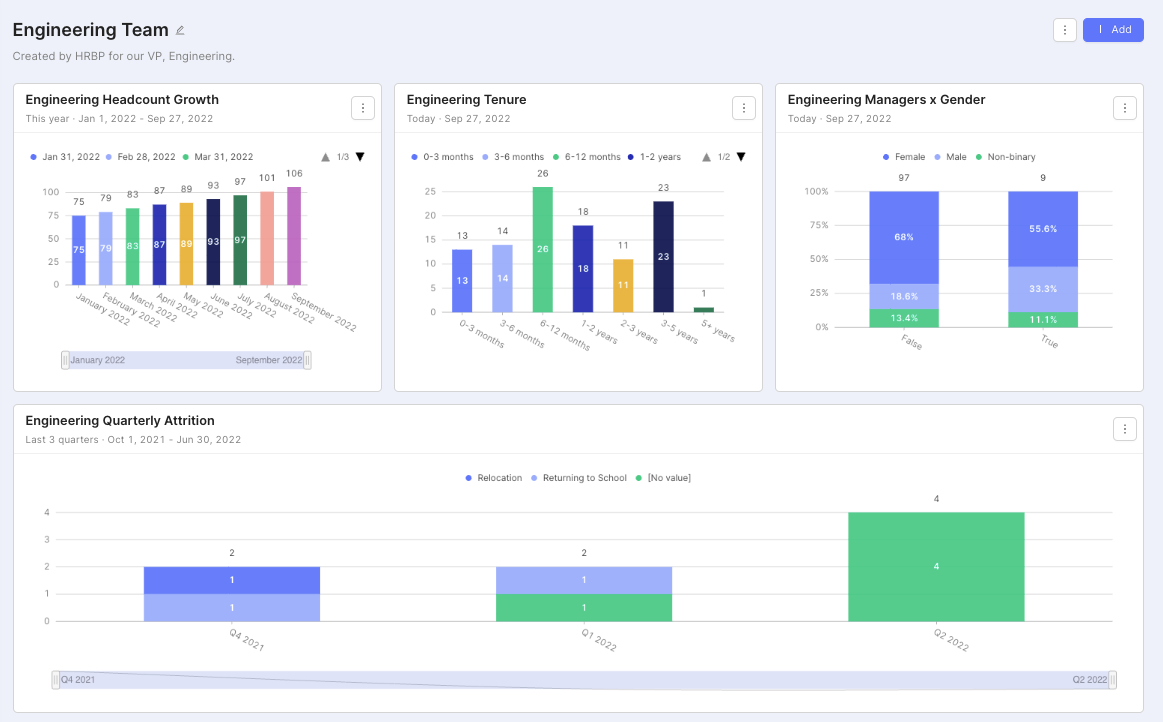
Department-Specific Insights
Build a dashboard to keep a pulse on the health of a specific team or department. This is ideal for business leaders or HRBPs who focus on specific team health.
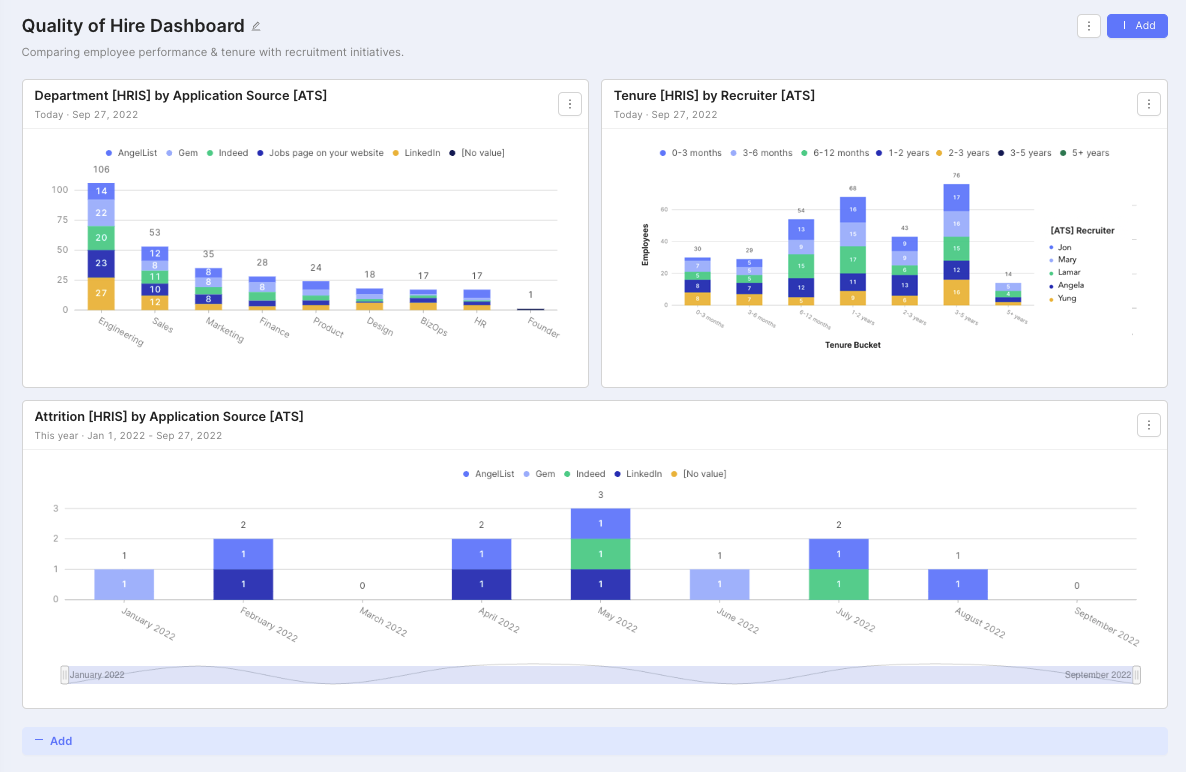
Quality of Hire Dashboard
Tie your recruitment metrics to your current workforce to improve your recruitment process. Learn more about Quality of Hire analytics here!
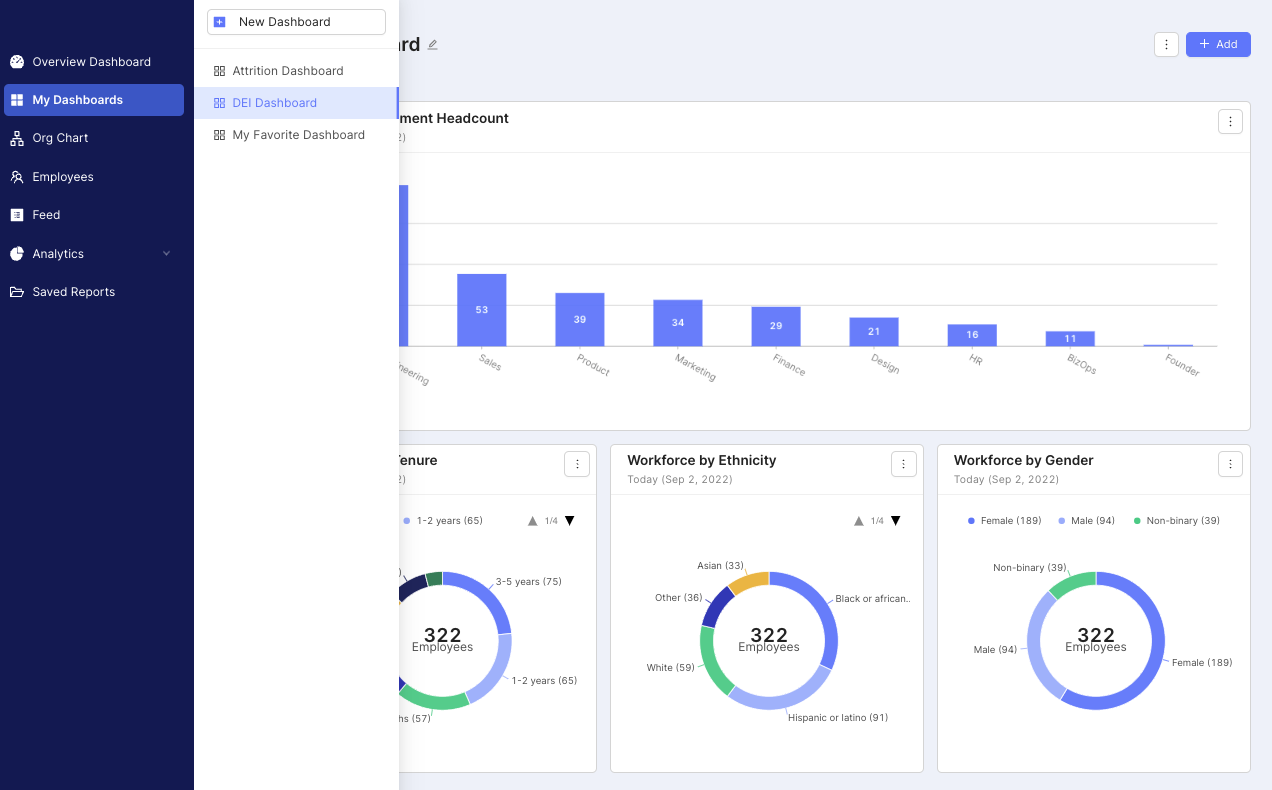
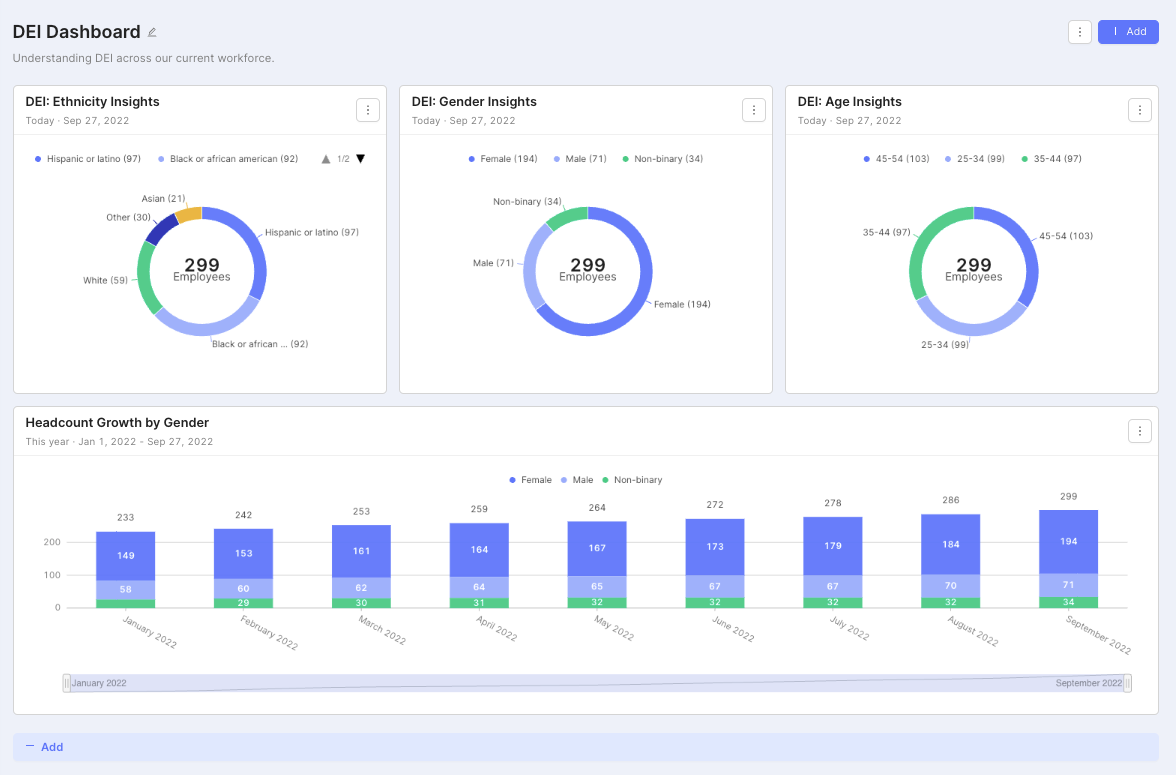
DEI Dashboard
Give your DEI leader or a specific executive and overview of the company's DEI breakdown in relation to goals, such as headcount growth. You may include insights like:
- DEI breakdown at a company-level
- DEI breakdown at a department-level
- Headcount growth over time across any DEI value
Questions or feedback? Contact your CSM or email us at success@knoetic.com.