Attrition Analytics
![]() Updated
Updated
Understand why people leave, inform your strategy, and reduce churn.
Data informs actions. Whether you know where to start or not, follow the patterns across your recent terminations to uncover areas of opportunity and growth with our Attrition analytics.
Overview of Attrition Analytics
At a high level, our Attrition analytics will tell you three things:
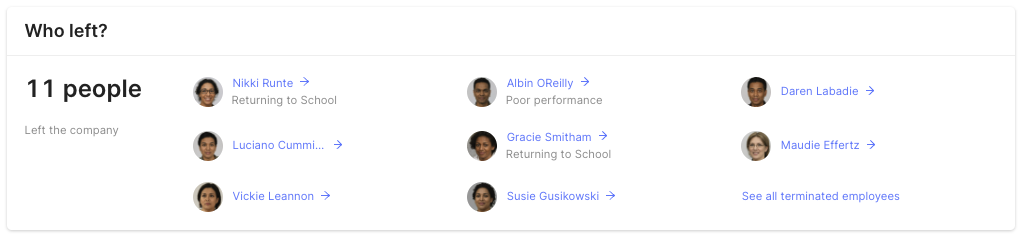
- Who left the company
- When and why they left
- Metrics like Annualized Attrition rate to measure the potential impact
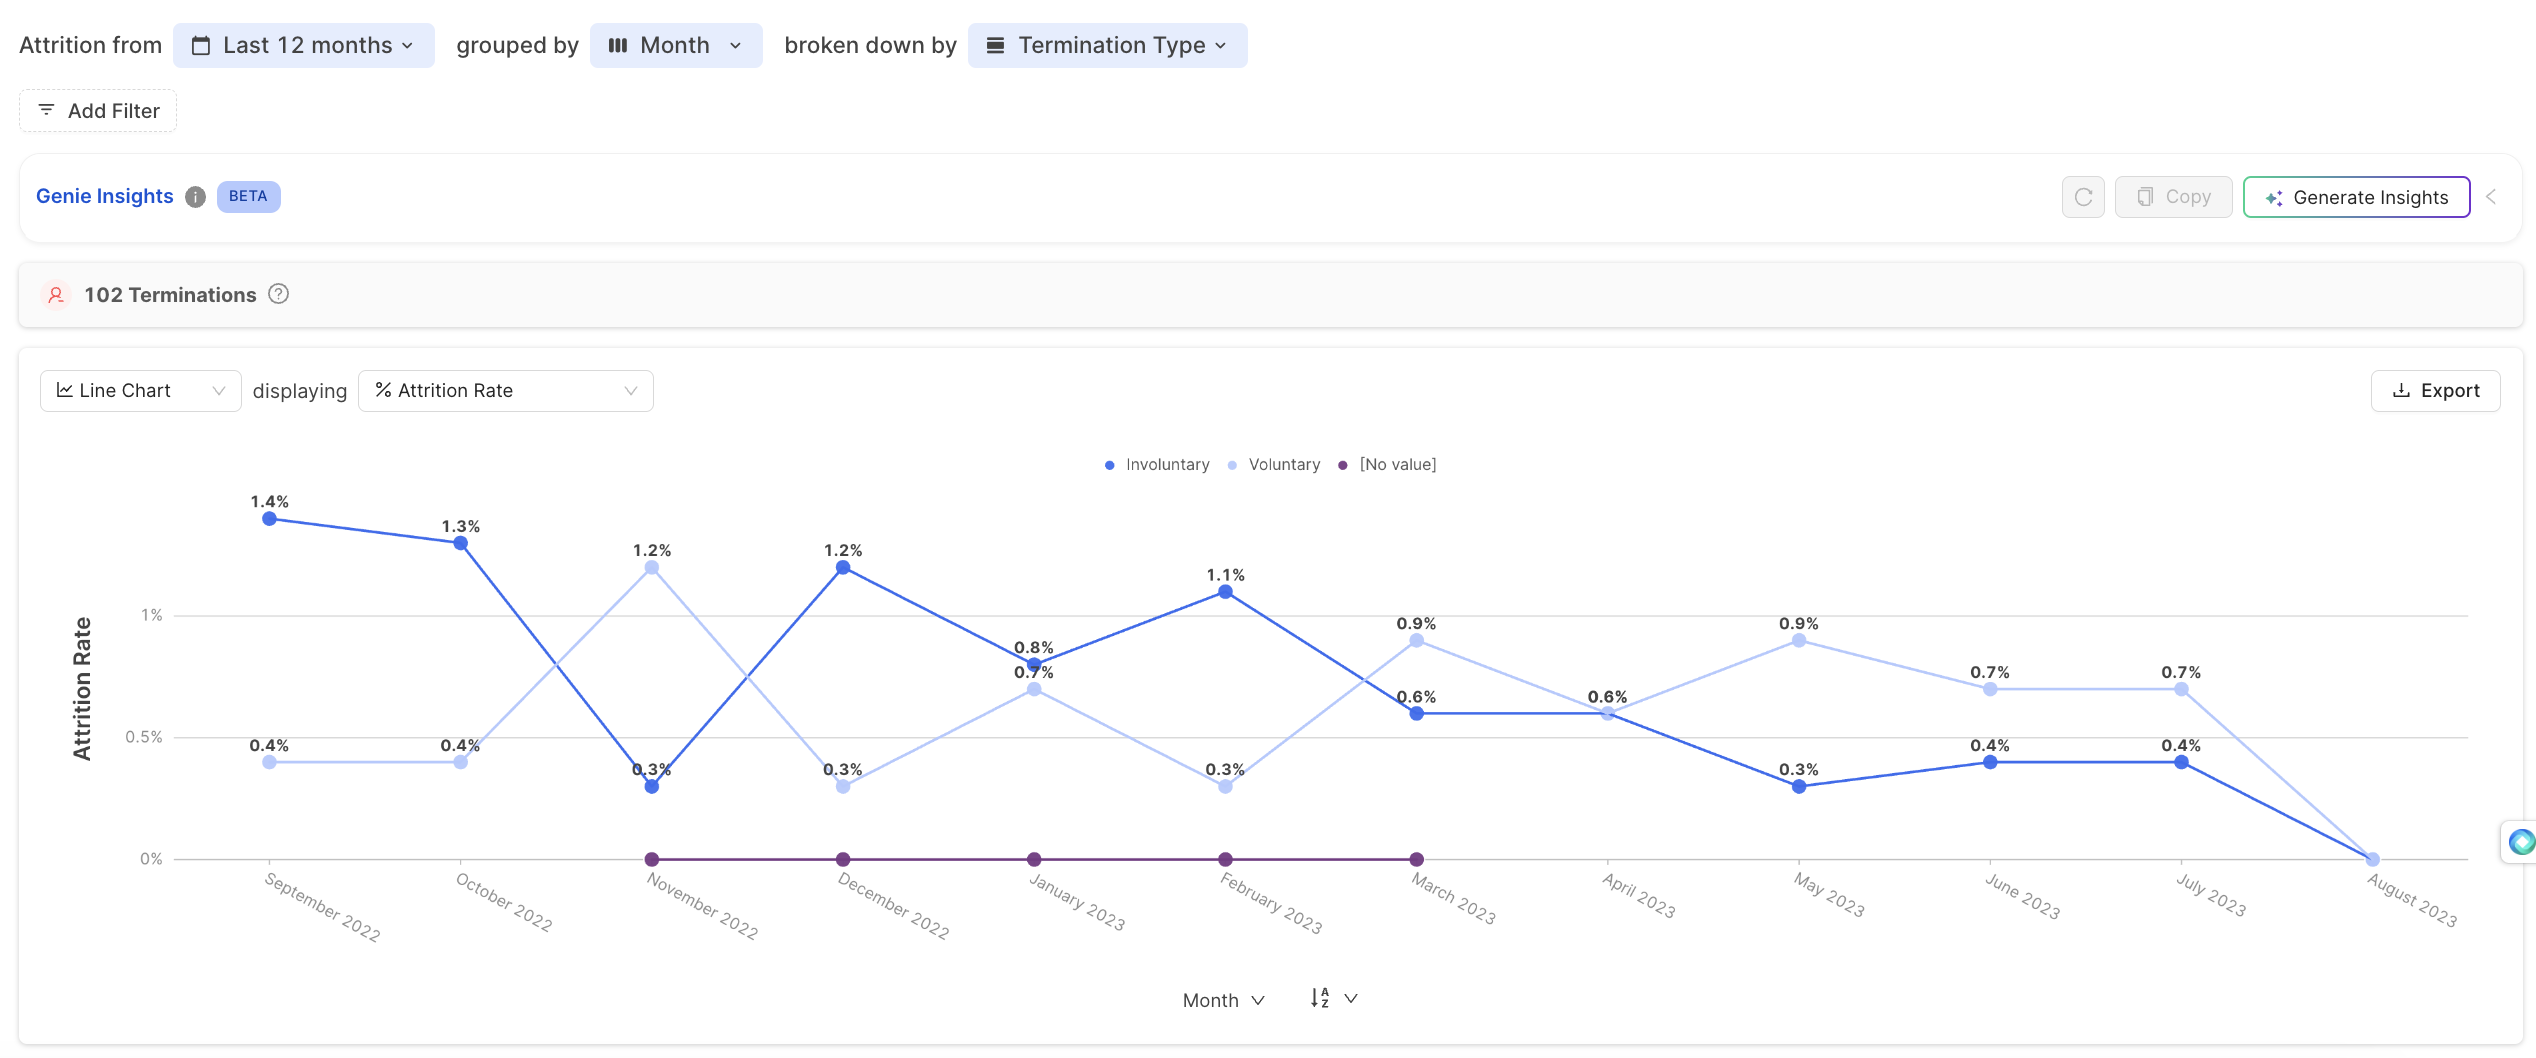
Creating an Attrition Report
- Log into Knoetic and go to Attrition analytics
- Select the Time Period you'd like to analyze
- Group your data by a field
- Add a breakdown to analyze your data further (typically this is Termination Type, Termination Reason, or Department).
A list of terminated employees from your selected time period will be listed below your chart. You can click "See all terminated employees" if you'd like to review the full list.
Analyzing the Attrition Table
Below your chart will be a data table that includes important metrics, like Termination Count and Annualized Attrition. Hover over any underlined term or number for additional detail into our attrition formulas.
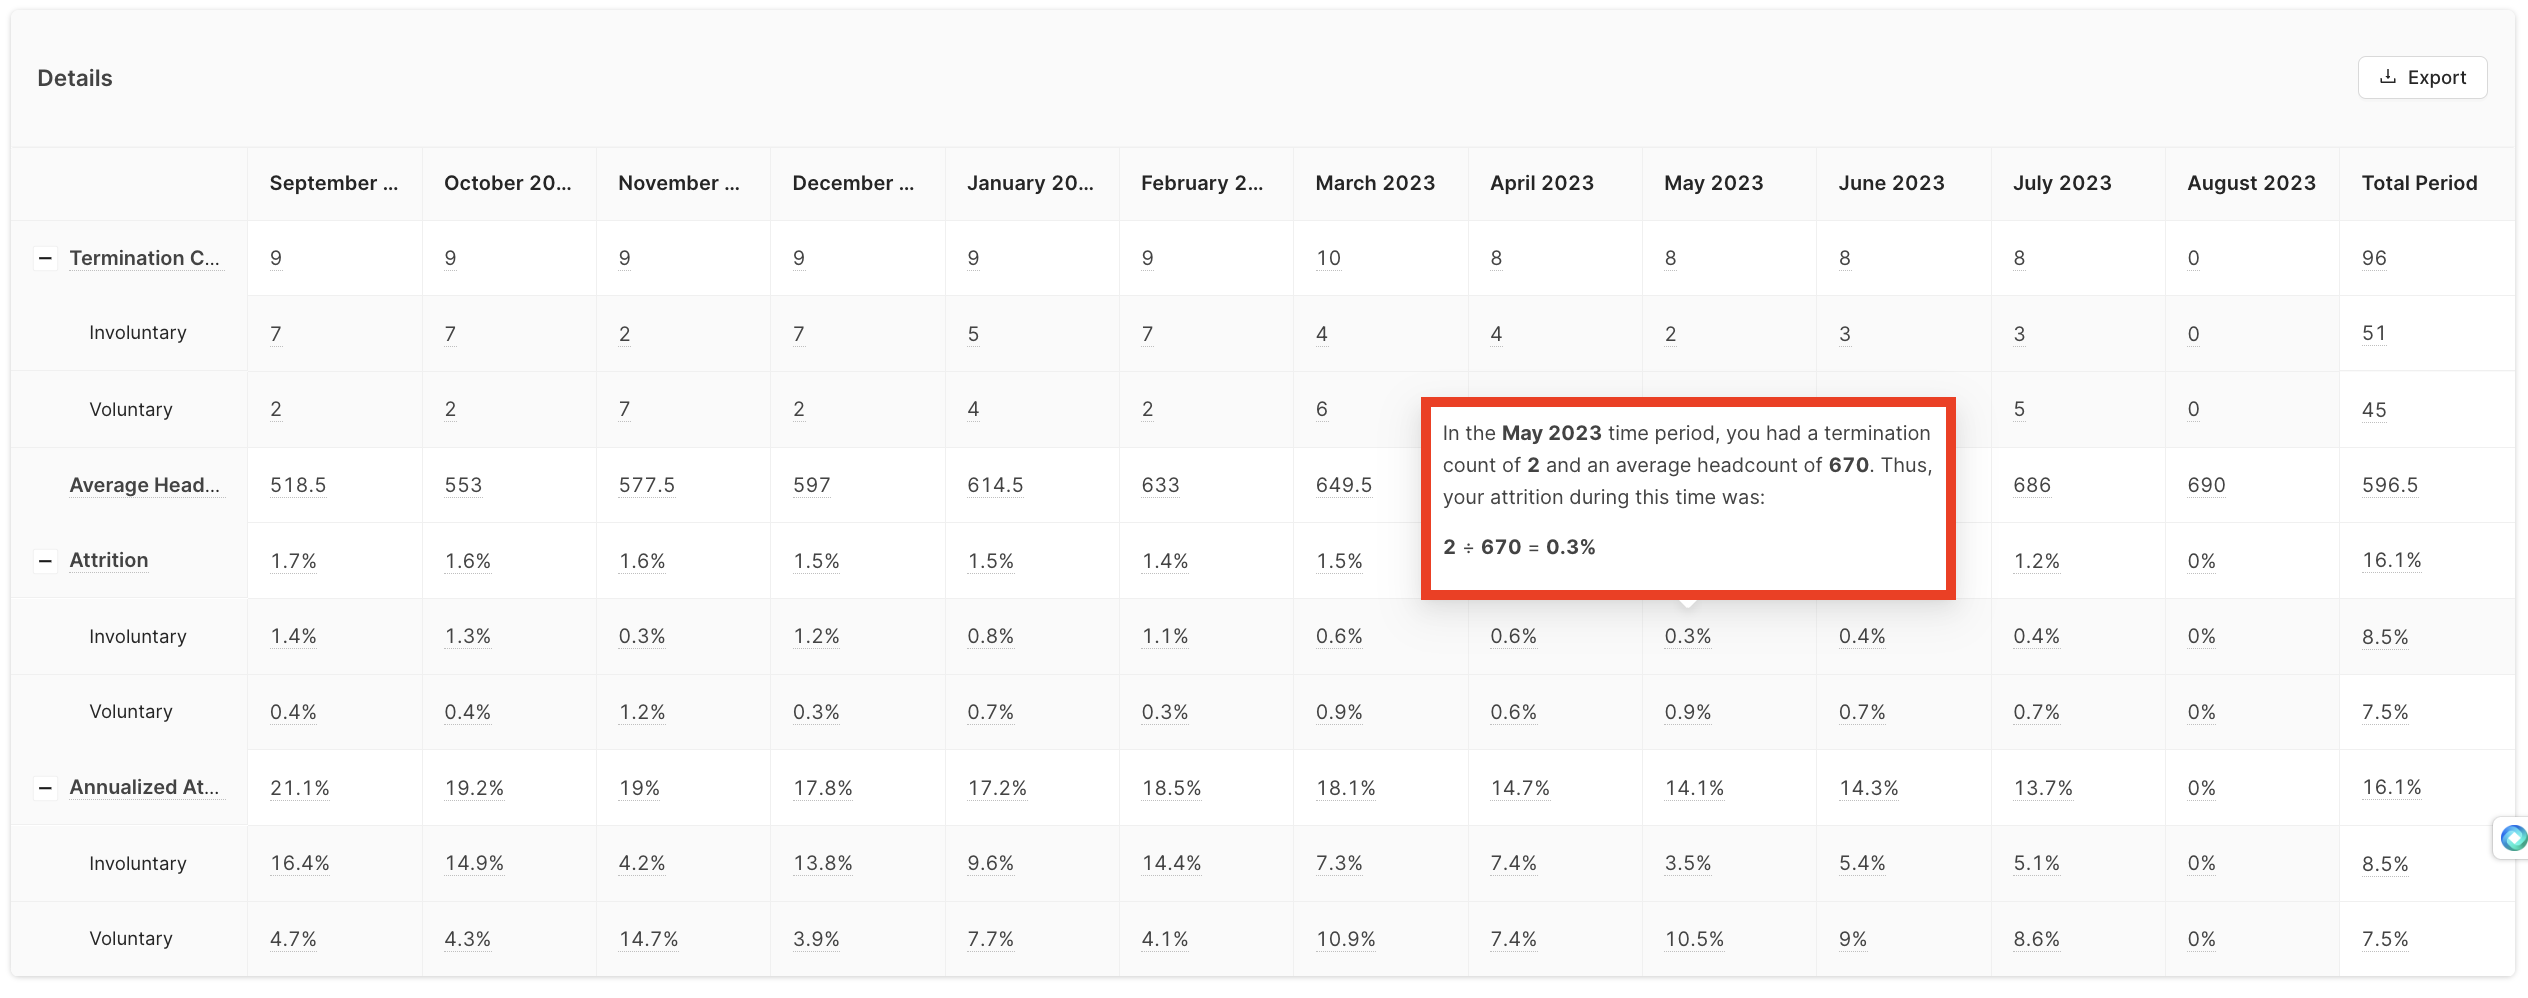
- Termination count is the number of employees who had termination events in the given period.
- Average headcount is calculated by adding the starting and ending headcount in the period and dividing the sum by two.
- Attrition rate is the percentage of your workforce that left during the given period. This is computed by dividing the termination count by the average headcount for that period.
For example, in the Q1 2022 time period, you had a termination count of 3 and an average headcount of 241. Thus, your attrition during this time was --> 3 ÷ 241 = 1.2% - Annualized attrition rate is the percentage of your workforce that left during the given period, converted to an annualized number.
For example, in the Q1 2022 time period, your attrition was 1.2%. This attrition occurred over 90 days. To get your annualized attrition, this number is converted to the equivalent value for a 365-day year.
Tips for Uncovering Trends
Sometimes, it's hard to know where to start when you're looking for trends. Here's an example of how to follow signal:
- Start at a high level—a general attrition report with no filters, but add a Data Group (e.g. Department)
- Review which department had the highest turnover in your time period
- Now filter to that specific department to narrow your focus
- Begin applying additional values (like Termination Reason, Termination Type, or Manager) to look for any glaring trends across that department's attrition data.
- Perhaps you notice that 80% of the team left voluntarily, or on their own.
--> Were there any recent changes on the team (e.g. new manager)? How engaged is this team generally? How have they been performing? Did an influential colleague leave? - Take it a step further—click through a data point on your chart to review a list of employees or venture down to an employee profile.
--> Was this employee a high performer? Were they given opportunities for career growth? - Continue to ask questions and evolve your thinking until you get to a compelling hypothesis. Share your findings with leaders who can fill in the gaps to complete the story.
Genie Insights
Be sure to leverage Genie Insights whenever you're looking to understand your data at a glance and brainstorm action items on ways to improve it!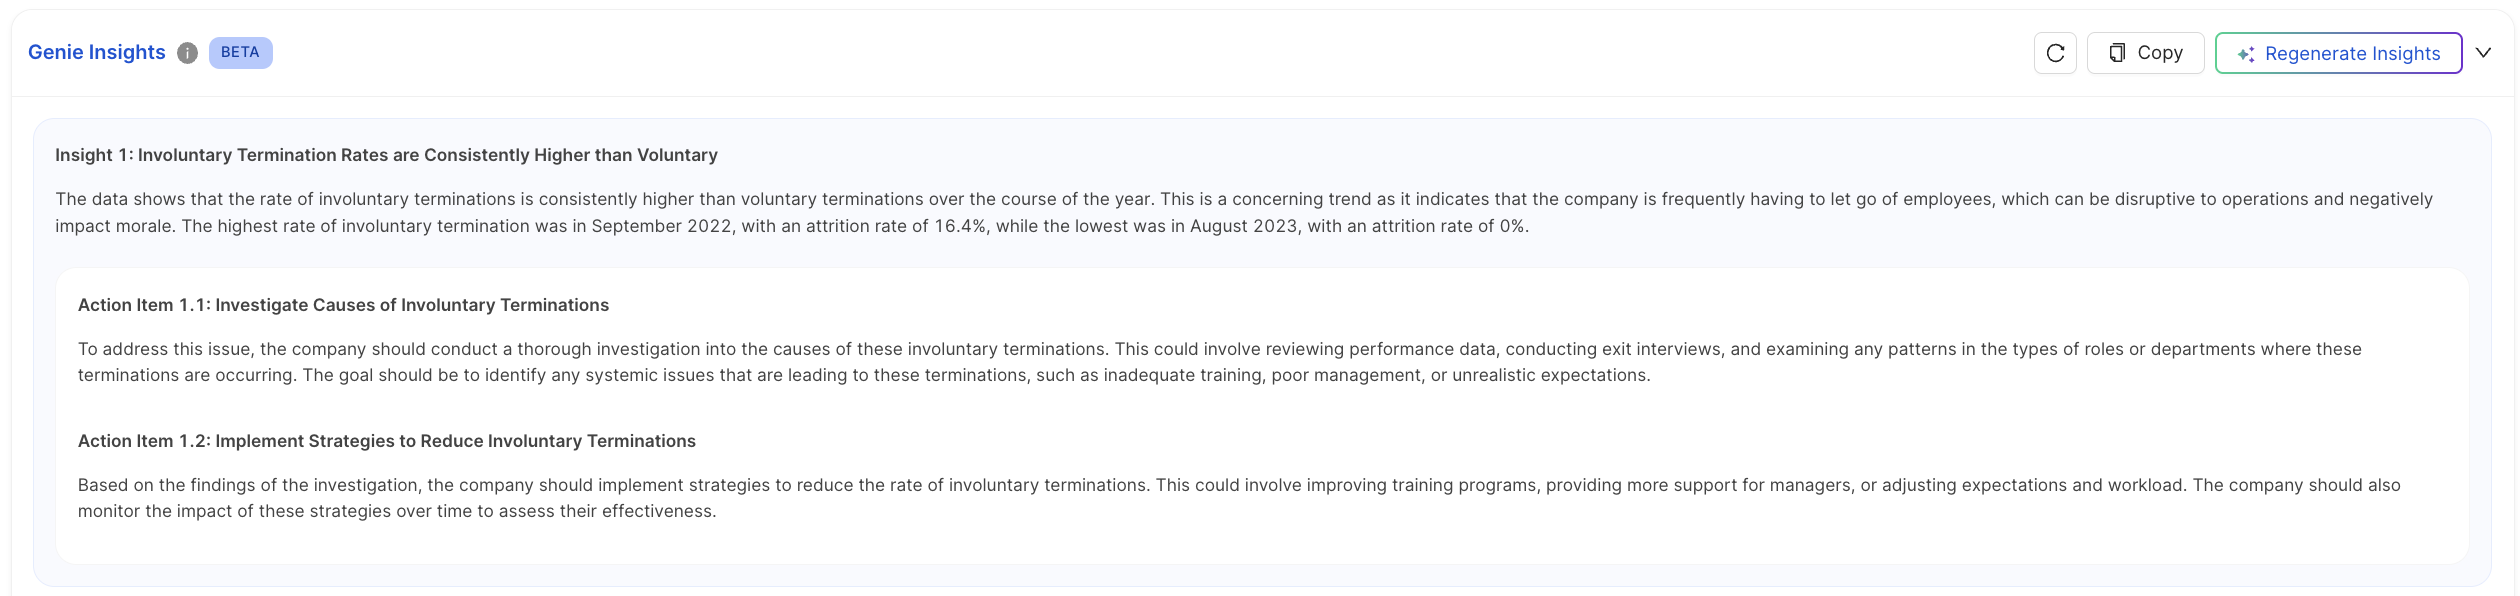
Common Attrition Fields
During exit interviews, teams will often gather data about why an employee is leaving. These data points are collected to later review trends across the company's termination data.
- Termination Type (or Term Type) tells you if the employee leave was their own initiative. There are typically two values: Voluntary and Involuntary.
- Voluntary attrition occurs when an employee leaves of their own volition.
- Involuntary attrition occurs when a company dismisses an employee.
- Regretfulness is a value for whether the company regrets an employee's departure.
- Regrettable attrition means that the company wishes the employee had not left.
- Non-Regrettable attrition means that the company does not regret the departure.
- Termination Reason is a coded reason for why the employee left. It tells a story around why employee attrition is trending overall and if there are areas for improvement within the company.
- Rehire Eligibility is usually a Yes or No value that signifies if the employee can be rehired at a later date.
Predictive Attrition Analytics
Knoetic is beginning to develop predictive attrition analytics with Knoetic's defined Attrition Risk data field. This field has 3 categories of attrition risk: low, medium, and high
- Low attrition risk: An employee with less than 1 year in current role and less than 1 year since last salary change
- Medium attrition risk: An employee with less than 1 year in current role or less than 1 year since last salary change
- E.g. Employee A's time in role is longer than 1 year, but they had a salary change less than 1 year ago
- High attrition risk: An employee who has a tenure of 2 years or less who has not experienced either a role change or salary change